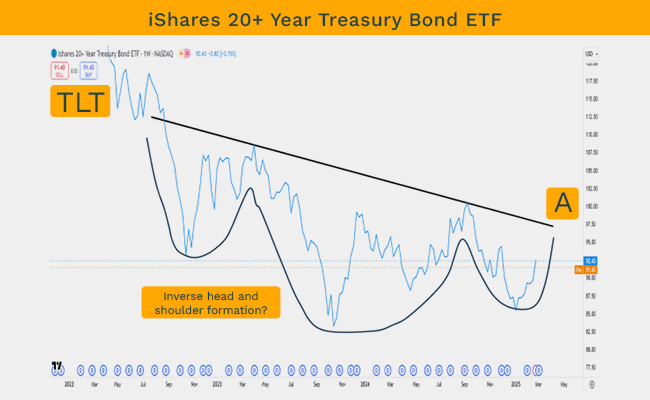
iSHARES 20+ Year Treasury Bond (Nasdaq – TLT) is an ETF that seeks to track the investment results of an index composed of US treasury bonds with remaining maturities greater than 20 years. The TLT is known as a predictor of where interest rates may be headed. Keep in mind that this instrument trades in dollars.

For starters, the line chart is slowly gaining momentum and is sending early signals that expectations are on the rise for higher interest rates to come.
An inverse head-and-shoulder formation (also reflecting the possibility of higher rates) is possibly in the making. Inverse head-and-shoulders are often reversal patterns, triggering some upward momentum in the price.
Above line A we may see confirmation of the possibility of higher interest rates, but below the second line, the instrument could go lower, wiping the possibility of higher interest rates off the table, and setting the scene for a reduction in interest rates from current levels.
This analysis reflects the personal opinion of the writer and should not be taken as financial advice.
Sign up to Currency’s weekly newsletters to receive your own bulletin of weekday news and weekend treats. Register here.


