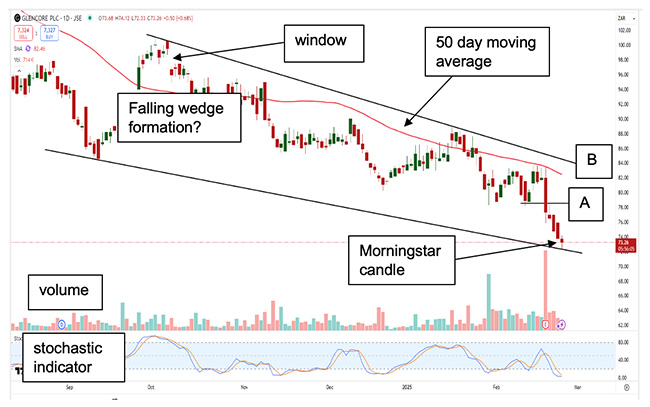
In this week’s technical analysis chart, we look at Glencore’s stochastic indicator. Now, that may sound like something you choke on but, simply put, it’s a momentum gauge used to determine whether a stock is overbought (too high) or oversold (too low). In the case of one of the world’s largest diversified commodity companies, it shows that Glencore’s shares have fallen too far, too fast, which may trigger a relief rally.

It’s also worth noting the recent spike in trading volumes, so buyers will only be too happy if line A turns into a show of support.
A window for the shares to rally to between R97.50 and R98.64 is open while the downward pressure on the stock persists. However, once that momentum shifts, that window may eventually close.
The falling wedge formation, which forms when a share price moves lower within a narrowing downward-sloping channel before eventually breaking out to the upside, is keeping the downward momentum in place, but a breakout above line A (R78.53) may see the first sign of technical strength.
The tiny Morning Star candle, a candlestick pattern that indicates a potential shift from a downward trend to an upturn, implies that some investors are buying into weakness.
Above line B (R83.26), the wedge may come into play, and if we reach the upper target of the formation, we may see R97.31.
Below R73.52, the share may go even lower, with possible targets at: R73.13, R73.00, R72.68, R72.43, R72.12, R70.89, R69.45, R68.33, R67.30, R66.43, R65.32, R64.78, R63.66, R62.73 and R61.44, with R60.40 not being an impossible target.
- For traders: buy or go long above line A if you believe recent buyers are correct, but use R70.89 as a stop-loss to protect capital. The possible targets to the top are: R79.48, R80.43, R81.22, R82.50, R83.77, R84.53, R85.34, R86.33, R87.30, R88.78, R89.22, R90.87, R91.00, R91.56, R92.45, R93.20, R94.67, R95.31, R95.88, R97.31, R97.50, R98.64, R99.09, R101.58, R103.72, R104.44, R105.89, R106.30, R107.54, R108.66 and R110.41.
- For medium- to long-term investors: do the same as the traders, using R80.30 as a stop-loss. Increase exposure above line B. Watch the 50-day moving average, the red line (R83.02), as it’s a good sentiment barometer for investors. Above the average suggests investors are optimistic, while a price below the average may point to nervousness towards the share. The average is a resistance.
Frans de Klerk is an independent technical analyst with more than 40 years’ experience in the markets.
Sign up to Currency’s weekly newsletters to receive your own bulletin of weekday news and weekend treats. Register here.


